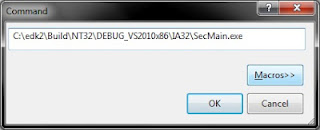
Last time, we looked at how to set up the Windows-hosted (NT32) UEFI environment provided by the EDK2. The NT32 environment is very useful for debugging UEFI applications which aren't tied to specific hardware devices. So in this article, I'll show how to add on debugging support in Visual Studio 2010.
This article assumes you have already loaded the Visual Studio project to build the EDK2's NT32 platform in C:\edk2 as described previously.

1. Select the NT32 project in the Solution Explorer. Select Project->Properties.
2. Select "Debugging" on the right. Select "Command" and click the drop-down arrow.

3. Click "<Edit...>" A separate editor window should open up. Enter "C:\edk2\Build\NT32\DEBUG_VS2010x86\IA32\SecMain.exe"
4. Do the same for "Working Directory" and enter "C:\edk2\Build\NT32\DEBUG_VS2010x86\IA32"
6. Now, since Environment variables no longer work for NT32, we need to actually change the DSC file. Open up Nt32Pkg.dsc (located in C:\edk2\Nt32Pkg\Nt32Pkg.dsc).
7. Find the section labeled "Pcd Dynamic Section."
8. Find the line for PcdWinNtGop and change it so it reads
gEfiNt32PkgTokenSpaceGuid.PcdWinNtGop|L"GOP Window 1!GOP Window 2"|VOID*|52
9. Save and close the file.
Debugging
Now you are ready to actually debug. Press F5 (or select Debug->Start Debugging). It will always ask you if you want to rebuild the project, since we haven't added any source files which Visual Studio can use to determine if the project source has been changed. For now, choose yes and you will see the program begin to execute normally
You can halt the execution of the emulated UEFI environment at any time by selecting Debug->Break All. Then you can set some breakpoints on a specific function by using Debug->New Breakpoint->Break At Function and type in the function name. You can force a breakpoint by inserting a __debugbreak() into your code
As the code executes, you will notice that the Visual Studio output window talks about various DLLs being loaded. The Windows-hosted environment actually loads your UEFI drivers and applications as DLLs (look in PUT_FILEPATH_HERE). The actual main program is called SecMain.exe


7 comments:
How to debug HelloWorld sample application that is in MdeModulePkg\Application\. I tried to put break point in HelloWorld.c before executing helloWorld.efi from Shell, it is saying could not load debug symbols for HelloWorld.efi. I think HelloWorld program is not compiled for debug mode. What are the flags to be added for visual studio compiler for compiling UEFI applications in debug mode?
So you actually built HelloWorld.efi? If you execute dumpbin /headers HelloWorld.efi, you should see that the debug section contains the path to the PDB file associated with the .efi file. For example, here's one from a recent build of mine:
00000000 cv 7A 000185E0 185E0 Format: RSDS, {D45F7297-9F48-4
32D-AEB2-9EB8EB30AB8D}, 15, c:\frou\Build\NT32\DEBUG_VS2010\IA32\Sample\App
lication\SampleApp\SampleApp\DEBUG\SampleApp.pdb
So, in order to debug, you need to have the PDB file in the same place it was on the build machine so that Visual Studio can find them.
I built HelloWorld.efi by adding HelloWorld.inf to Nt32.dsc and i executed the dumpbin command for HelloWorld.bin and out put is as follows
00000000 cv 87 000027E8 27E8 Format: RSDS, {59806D35-3EF8-452D-8AEA-7BA3A0F802F3}, 1, e:\uefi\test\Build\NT32\DEBUG_MYTOOLS\IA32\MdeModulePkg\Application\HelloWorld\HelloWorld\DEBUG\HelloWorld.pdb
So, there should be a PDB file in e:\uefi\test\Build\NT32\DEBUG_MYTOOLS\IA32\MdeModulePkg\Application\HelloWorld\HelloWorld\DEBUG\HelloWorld.pdb. This file contains the debug information.
Hello,
I've got a very similar problem. When I try to debug the HelloWorld.efi-application Visual Studio 2010 tells me that "There is no source code available for the current location."
And the command window with the SecMain.exe tells me:
WARNING: No source level debug d:\edk2\Build\NT32\DEBUG_VS2010_x86\IA32\MdeModulePkg\Application\HelloWorld\HelloWorld\DEBUG\HelloWorld.DLL
But in that exact location there is a HelloWorld.pdb-file and the header-entry in HelloWorld.efi points also to the correct pdb-file.
Any hints where to have a further look?
Thanks. Regards,
Michael
Did a solution ever come to not being able to debug your own application? I have the same problem as mentioned by Michael/pdplaza. I have built my own Efi application, when I dump the header I see a path to my pdb file which does infact exist. I am unable to set breakpoints in my own code in VS. I am able to thrown in a __breakdebug(), however it breaks outside of my code not in it. Being able to debug UEFI is great, but being able to debug my own code in UEFI would be even better.
Tim, I got the .pdb file of my application but i am confused how to add it to VS 2010 and debug my application. Actually SecMain.exe is not loading myapp.pdb automatically. so is there any other way to load it ?
Post a Comment